What is Technical Analysis? Can I Read Crypto Charts?
What is technical analysis? How does technical analysis work? Here is the explainer.
In this article...
- Technical analysis is about examining charts to find patterns
- These patterns can possibly predict what will happy to the price in the future
- Here are the basics of technical analysis
What is technical analysis? And can it help you guess what will happen next in the crypto game? Read on to find out.
Technical analysis is all about examining charts, price patterns, and trading volumes of a . This is to identify trends and predict future price movements, based on the assumption that historical price patterns may repeat themselves.
believe that all relevant information about a cryptocurrency is already reflected in its price. And, that they can use technical analysis to understand the psychology of market participants. This is to hopefully anticipate future market movements.
Dow Theory and the key principles of technical analysis
In 1884, Charles Dow played a significant role in the creation of the Dow Jones Transportation Index (DJT). It was the first-ever stock market index.
There are six key tenets that form the core principles of technical analysis (they are also known as the Dow Theory). They were developed and refined by later technical analysts who built upon Dow's original ideas.
1. The market discounts everything
This means that all publicly available information about a cryptocurrency is already reflected in its price. Technical analysts use historical price data and market trends to predict future price movements.
2. Trends exist
Markets tend to move in trends, which can be identified using technical analysis. In a bull market, prices tend to rise over time. In a bear market, they tend to fall. There may also be shorter-term trends within larger trends.
3. Trends persist until there is evidence of a reversal
Once a trend is established, technical analysts assume that it will continue until there is clear evidence of a reversal. This allows traders to profit from the trend while avoiding losses from sudden reversals.
4. Technical analysts use charts and other tools to identify trends
Technical analysts use a variety of tools to identify trends, including charts, moving averages, and other technical indicators.
This helps them to identify important support and resistance levels that can be used to predict future price movements.
If you want to have a crack at it, gives customers access to free TradingView charting tools, which are built in.
5. Volume confirms trends
Increases in trading volume can help confirm the strength of a trend, while decreases in volume may suggest that a trend is losing momentum.
High trading volume in the direction of the trend is considered a positive sign. Low volume or volume in the opposite direction may indicate a potential trend reversal.
6. Trends can be classified as primary, secondary, or tertiary
Primary trends are the long-term trends that dominate the market.
Secondary trends are shorter-term movements within the primary trend.
Tertiary trends are even shorter-term movements that may not have a significant impact on the overall trend.
Technical analysts use these classifications to help identify trends and predict future price movements.
Multiple time frame analysis
A time frame is the length of time that a trend lasts in a market.
Multiple time frame analysis, also known as multi-time frame analysis, is the process by which traders examine a crypto’s price movement over multiple time frames.
The larger time frame is typically used to establish a longer-term trend because it provides more reliable signals. The shorter time frame is used to identify ideal market entries.
Time frames can range from minutes or hours to days and months.
Technical analysis charts
Traders analyse the markets in various ways, with various types of charts available for use.
Line chart
This is a simple chart that shows the closing prices of a cryptocurrency over a specific period, represented by a continuous line.
Line charts are useful for showing the overall direction of a trend over time.
Bar chart
This type of chart displays a cryptocurrency's open, high, low, and closing prices (OHLC) for a given time period.
Each bar on the chart represents a specific time frame, such as a day or an hour, and provides more detailed information than a line chart.
Point and Figure (P&F) chart
This type of chart uses Xs and Os to represent price movements, without considering the passage of time.
Xs represent upward price movements, while Os represent downward movements. Point and Figure charts are often used to identify long-term trends and support/resistance levels.
Candlestick chart
This is the most commonly used chart type in technical analysis. Each candlestick represents a specific time period and displays the cryptocurrency's open, high, low, and closing prices.
Candlesticks are colour-coded to indicate whether the price went up or down during the period. Technical analysts use candlestick patterns to identify trend reversals and potential entry/exit points.
Key technical indicators every trader should know
Technical indicators are tools used by technical analysts to help identify trends and potential trading opportunities.
Simple Moving Average (SMA)
This indicator shows the average price of a cryptocurrency over a specific time period. It is useful for identifying trends and support/resistance levels.
This indicator takes a set of price points for a cryptocurrency and divides them by the number of data points to produce a single trend line.
The data used in an SMA indicator is determined by the indicator's length. A 50-day SMA, for example, requires 50 days of data, whereas a 200-day SMA requires 200.
Exponential Moving Average (EMA)
Similar to the SMA, the EMA gives more weight to recent prices, making it more responsive to current price movements.
The EMA indicators can be combined with other indicators to help confirm and validate important market moves.
The most popular EMAs for short-term averages are 12- and 26-day EMAs, and 50- and 200-day EMAs for long-term averages.
Relative Strength Index (RSI)
This indicator measures the speed and magnitude of recent price changes to identify overbought or oversold conditions in the market.
The RSI is represented by a line graph ranging from 0 to 100. A reading of 70 or higher on the RSI indicates that the crypto asset is overbought. A reading of 30 or less indicates that it is oversold.
An overbought signal indicates that a short-term rally has reached its peak and the crypto is due for a price correction.
On the other hand, an oversold signal indicates that a short-term downtrend has reached exhaustion and the crypto is poised for a rally.
Fibonacci Retracement
This tool is used to predict how far a market may retrace from its current trend. A retracement is a temporary dip or pullback in the market.
Traders commonly use the Fibonacci retracement to confirm a perceived market move. It also helps in determining potential support and resistance levels, allowing traders to know when to open and close positions.
Bollinger Bands
Bollinger Bands are bands plotted above and below a cryptocurrency's SMA, based on standard deviation levels. The width of the band changes to reflect changes in the underlying crypto’s volatility.
The lower the volatility, the closer the bands, and vice versa. They are mostly used to predict long-term price movements.
Bollinger bands, like the RSI, can be used to predict long-term price movements and identify overbought or oversold conditions in the market.
If the price of a crypto asset consistently touches or breaks outside the upper Bollinger band, it may indicate an overbought signal.
If it continuously touches or breaks below the lower band, it may indicate an oversold signal.
Chart patterns
Chart patterns are shapes or formations that appear on a price chart and provide insight into future price movements.
Technical analysts use chart patterns to identify potential trends in the price movement of cryptocurrencies and make informed trading decisions.
Support and resistance
These are price levels where the market has previously experienced buying or selling pressure. During a price rally, the highest level reached before a pullback becomes resistance.
When the price rises again, the lowest point reached before the rise becomes support. Support and resistance levels are constantly formed as the price fluctuates up and down over time.
Trend channel
A trend channel, also known as a price channel, is a technical analysis tool used by traders to identify the current trend in a cryptocurrency's price action.
It is formed by drawing two parallel trend lines along the highs and lows of the price action. The upper trendline acts as a resistance level, while the lower trendline acts as a support level.
Trend channels are used by traders as entry signals because they can help identify potential buying or selling opportunities.
When the price action is near the upper trendline, it may be an indication to sell, while when it is near the lower trendline, it may be an indication to buy.
Head and shoulders
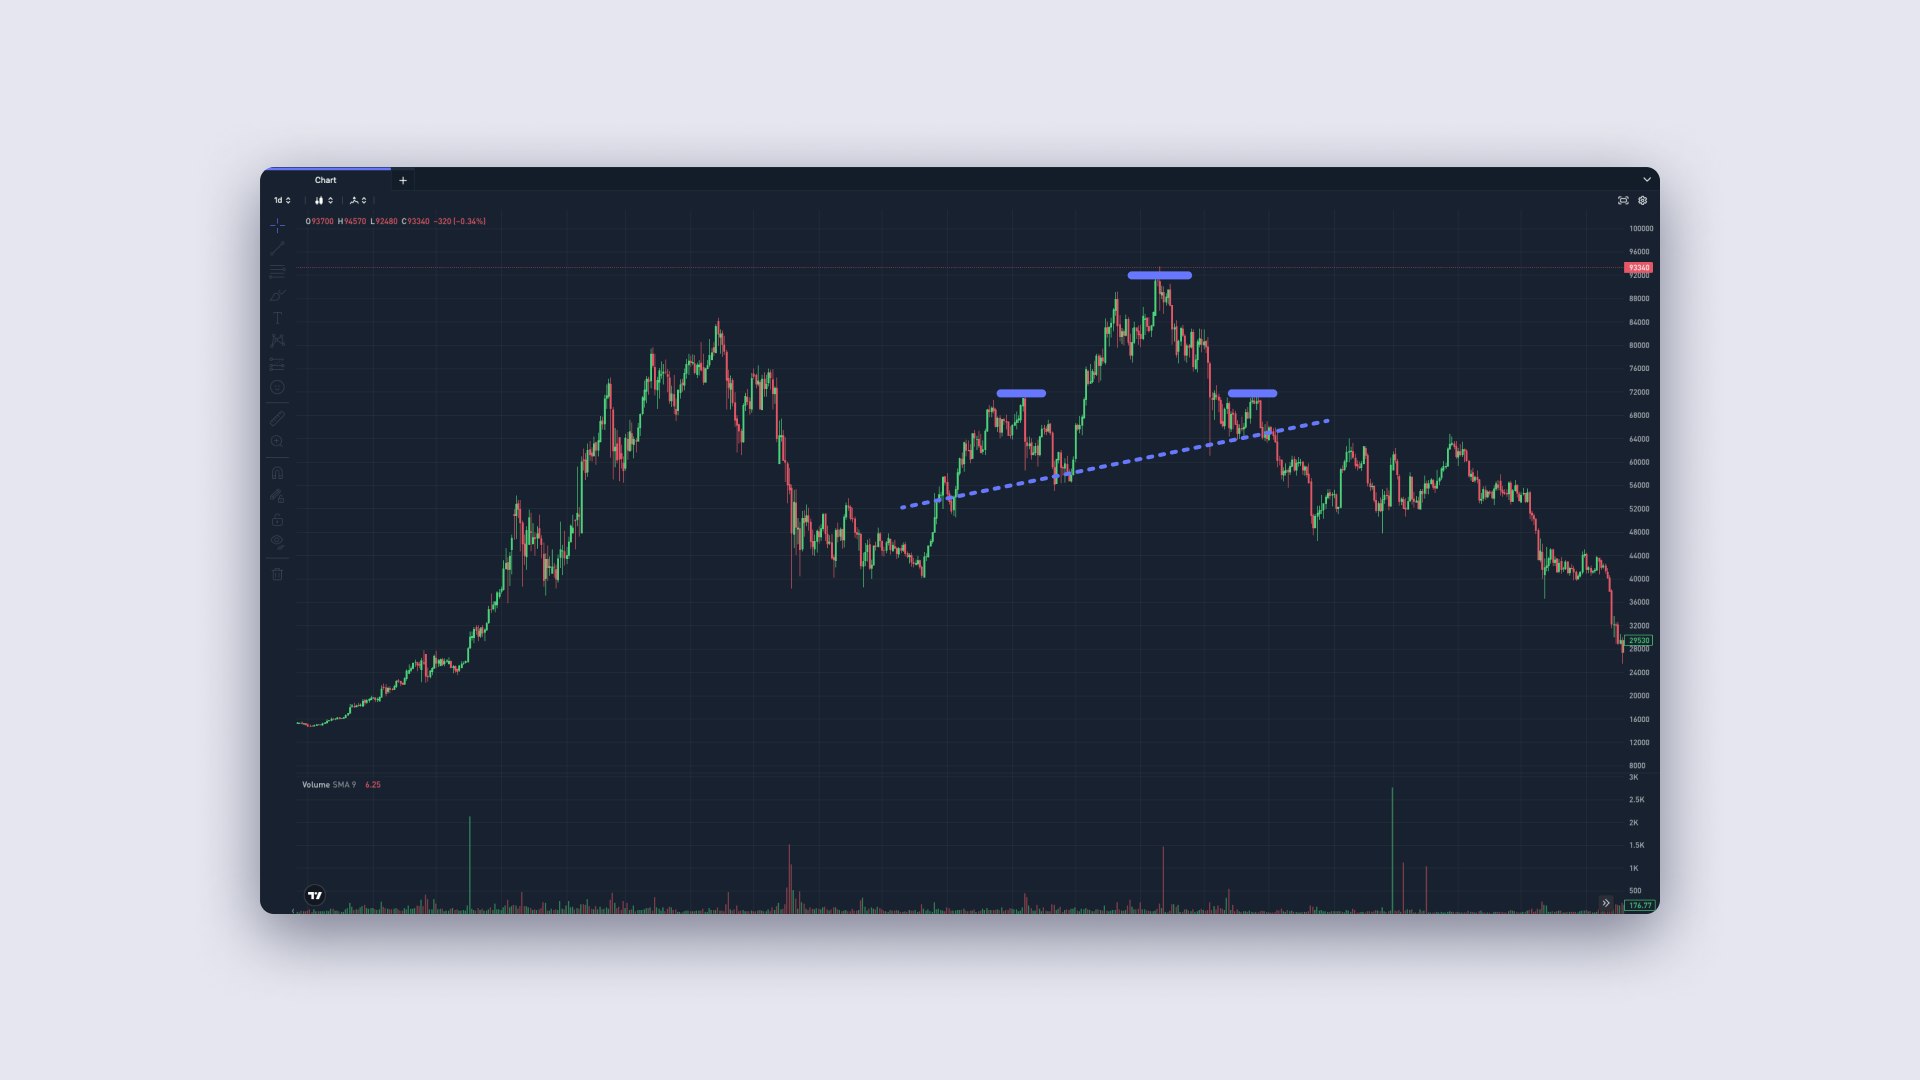
This is a bearish reversal pattern that is characterised by three peaks: a higher peak in the middle, known as the head, and two lower peaks on either side, known as the shoulders.
The neckline is a support level that connects the lows between the left shoulder, head, and right shoulder.
The formation of a head and shoulders pattern indicates that the cryptocurrency's price is likely to move lower, and traders may consider opening short positions. Once the price breaks below the neckline, it is a signal that the bearish trend has been confirmed.
Conversely, an inverse head and shoulders pattern is a bullish reversal pattern that is characterised by three troughs. These are a lower trough in the middle, known as the head, and two higher troughs on either side, known as the shoulders.
The neckline is a resistance level that connects the highs between the left shoulder, head, and right shoulder. When the price breaks above the neckline, it is a signal that the bullish trend has been confirmed, and traders may consider opening long positions.
Double top
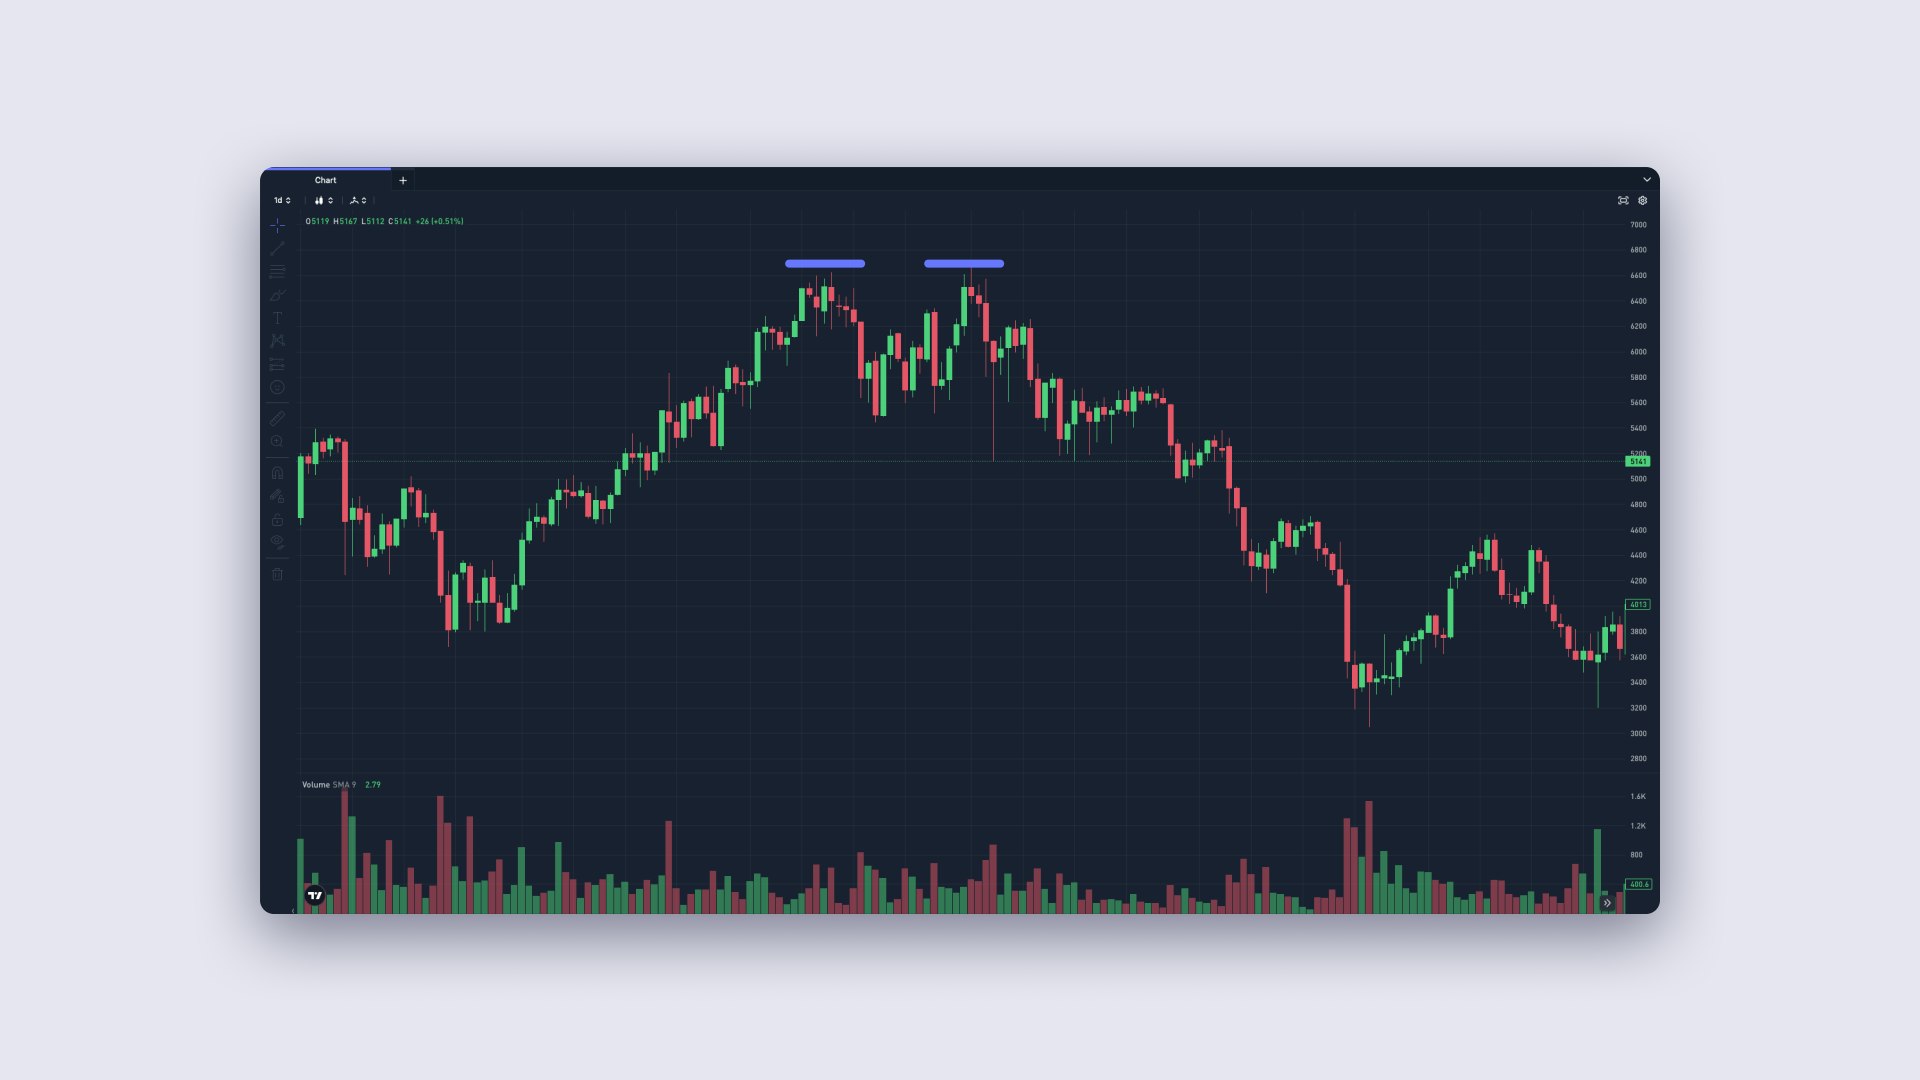
A double-top chart pattern is a bearish reversal pattern that occurs when the price hits the same high twice and fails to break out the second time.
This creates a pattern resembling the letter M, with the two peaks representing the rejection points. The minor support level that forms in the middle is called the neckline.
Once the price falls below the neckline, it is a signal that the bearish trend has been confirmed, and traders may consider opening short positions.
Triangles
Triangle chart patterns occur when the price of a cryptocurrency moves within a converging range of highs and lows, forming a triangle-like shape on the chart. These patterns are classified into three types based on the shape of the triangle.
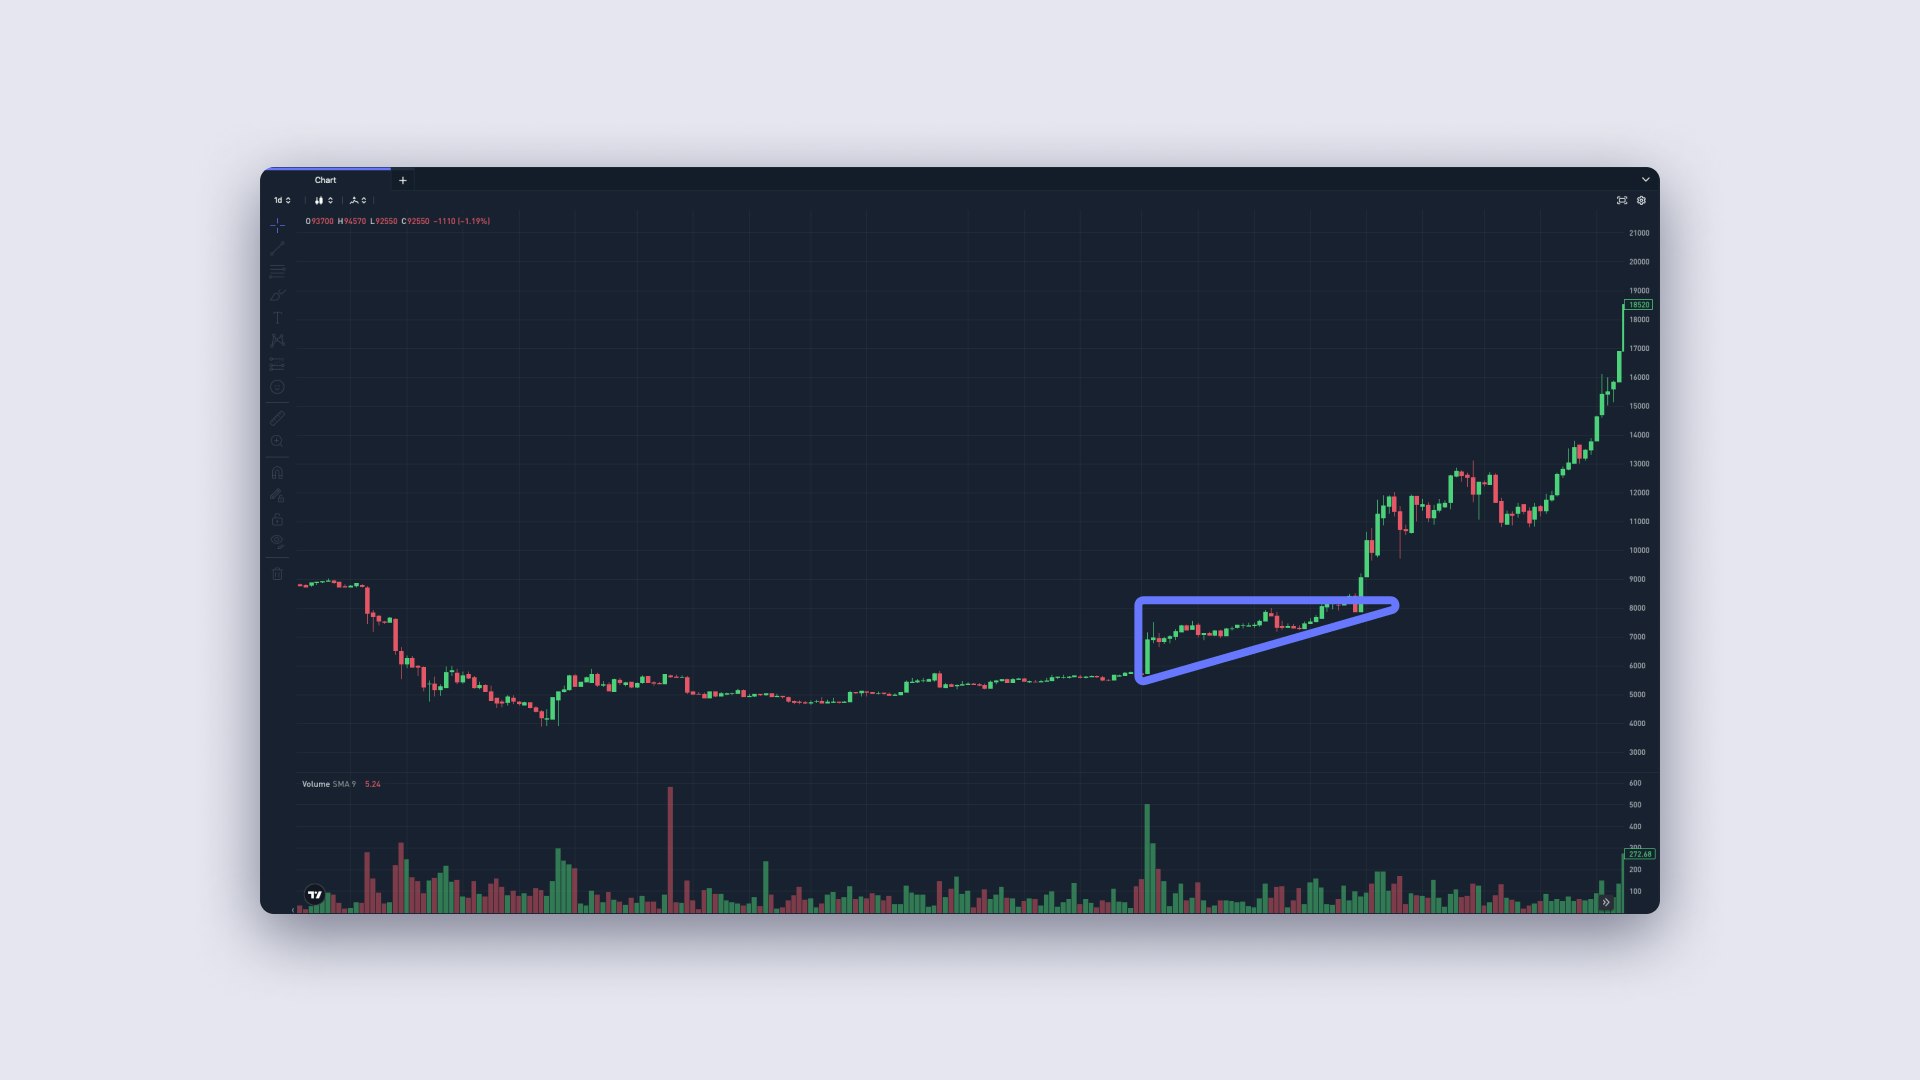
Ascending triangle
This pattern has a flat top line and a rising bottom line. It typically forms during an uptrend and is considered a bullish pattern.
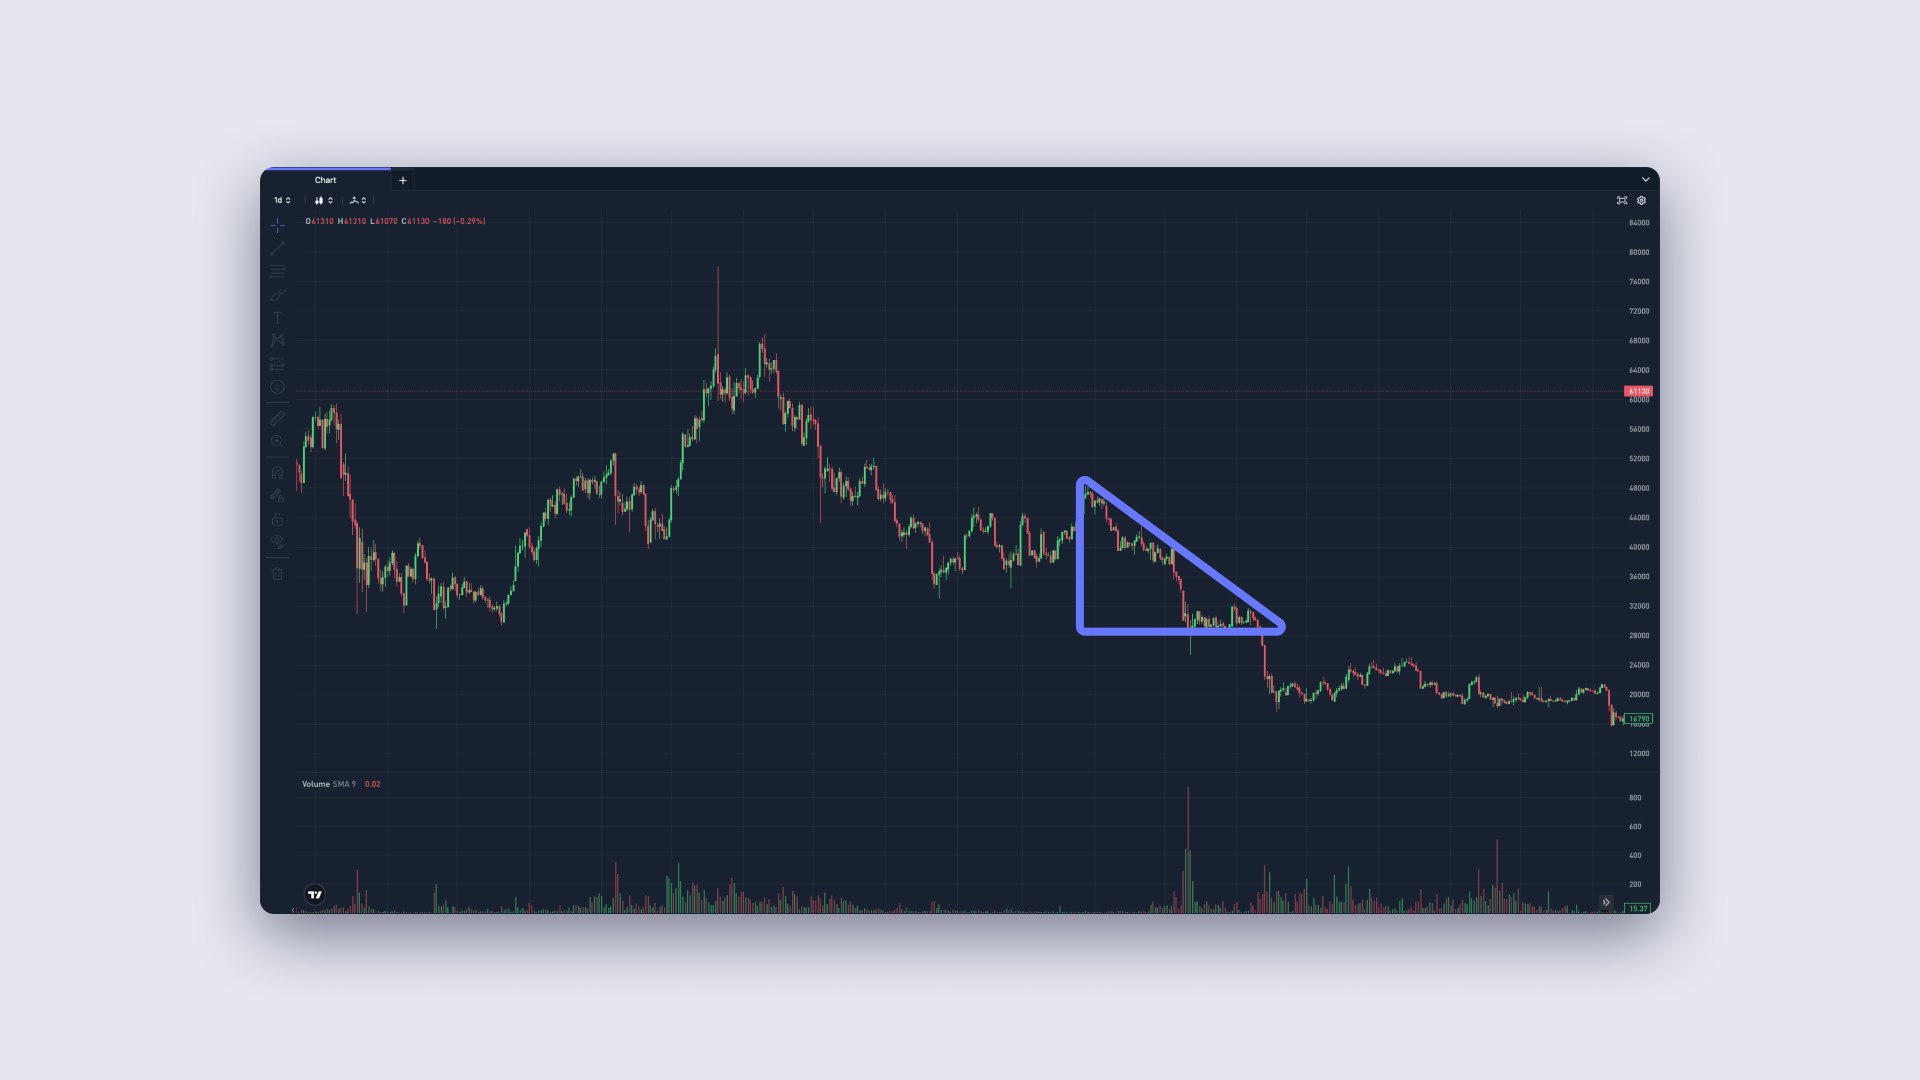
Descending triangle
This pattern has a flat bottom line and a declining top line. It typically forms during a downtrend and is considered a bearish pattern.
Symmetrical triangle
This pattern has both a rising and declining trendline that meet at an apex. It can form during both uptrends and downtrends and is considered a neutral pattern until a breakout occurs.
Risk management in technical analysis
Risk management is an essential component of any successful trading strategy. Risk management is important because it enables traders to identify, assess, and control potential trade risks.
There are several principles that every technical analyst should consider to successfully manage risk.
These include clearly defined risk and reward objectives, portfolio diversification, the use of stop-loss orders, and effective position sizing.
Combining technical analysis with fundamental analysis
Fundamental analysis looks at a crypto’s economic and financial factors to determine its value. This can be accomplished by examining the project's financial situation as well as the current market conditions.
Combining fundamental analysis with technical analysis results in a holistic trading strategy that allows a trader to benefit from the best of both worlds.
There are various ways to combine fundamental and technical analysis. One effective way is to use fundamental analysis to identify promising cryptocurrencies and assess whether they are overvalued or undervalued.
This helps to mitigate risk by avoiding overpriced assets. After selecting the suitable cryptocurrencies, technical analysis can be used to determine the optimal entry point, manage the investment, and time the exit.
The role of trader psychology in technical analysis
Trading psychology refers to the mental state and emotions that influence a trader's success or failure. It represents various aspects of a trader's behaviour that influence their trading decisions.
When trading, trading psychology is just as important as knowledge, experience, and skill.
Trading psychology is dominated by fear and greed. Greed in trading refers to an irrational desire for profit that can cloud one's judgement when making trades.
An example of a greed-driven trade would be one in which a trader purchases a cryptocurrency solely based on social media hype. This is without conducting independent research. Or, it could mean holding onto a rally for too long in the hope of earning more profits.
Conversely, fear can cause traders to exit a trade prematurely, leading to mass sell-offs and panic selling during bear markets.
Limitations of technical analysis
There are some disadvantages of technical analysis.
False signal
The mathematical factors that contribute to a signal are not always accurate, and the market may move in the opposite direction.
Open to interpretation
There is no one rigid method of analysing charts, and two technical analysts may look at the same chart and see two different patterns, both of which can be justified.
Ignores fundamentals
Technical analysis ignores other important factors such as economic releases and outside market conditions.
Conclusion
Technical analysis is not just limited to chart pattern analysis. It involves behavioural economics and risk management to identify profitable trading opportunities and execute them using a consistent strategy for optimal long-term returns.
While technical indicators can occasionally be incorrect, it is crucial to develop a positive attitude and learn how to handle adverse market situations.

Frequently asked questions
How does technical analysis claim to help predict future price action in financial markets?
Technical analysis assumes that history tends to repeat itself in financial markets. By studying past price trends using tools like moving average convergence divergence (MACD), traders can try to identify patterns and trading signals.
These signals, combined with an understanding that prices move in trends, help traders develop a trading system for potential short-term or long-term trading opportunities. Essentially, traders use technical analysis to interpret past price moves to anticipate future price action and make trading decisions.
Understanding technical analysis however is not a guarantee of future profits.

Suggested Articles
What is Ethereum? What is ETH Used For?
Ethereum is a decentralised blockchain-based open-source software platform that allows for the development of decentralised applications (dApps).What is Bitcoin (BTC)? What is "Digital Gold" Used For?
What is Bitcoin? It is a digital currency that can be traded, exchanged, and used as a form of payment independent of central banks and governments.What Is Crypto? How do Cryptocurrencies Work?
Crypto has become incredibly popular. But how does this digital currency work? And are there cryptos other than Bitcoin?Browse by topic
CoinJar’s digital currency exchange services are operated by CoinJar Australia Pty Ltd ACN 648 570 807, a registered digital currency exchange provider with AUSTRAC.
CoinJar Card is a prepaid Mastercard issued by EML Payment Solutions Limited ABN 30 131 436 532 AFSL 404131 pursuant to license by Mastercard. CoinJar Australia Pty Ltd is an authorised representative of EML Payment Solutions Limited (AR No 1290193). We recommend you consider the and before making any decision to acquire the product. Mastercard and the circles design are registered trademarks of Mastercard International Incorporated.
Google Pay is a trademark of Google LLC. Apple Pay is a trademark of Apple Inc.
This site is protected by reCAPTCHA and the and apply.