Bitcoin Dominance: Is Alt Season Near? Technical Analysis May Provide Clues
What is Bitcoin Dominance? And how can keeping an eye on it give insight into alt season? Here is the explainer.
In this article...
- What is Bitcoin Dominance?
- Understanding Bitcoin Dominance can give insight into altcoins
- Here's how to find out things you didn't know before using Bitcoin Dominance.

Bitcoin dominance (BTC.D) could be way more important than most investors realise. So here’s an easy explanation on why this should be on your radar before you or any other altcoin.
refers to the percentage of the total cryptocurrency market capitalisation that is attributed to Bitcoin. It is a metric used to gauge Bitcoin's market strength relative to the entire cryptocurrency market.
Bitcoin dominance isn't often discussed enough in the crypto space, even though it can be a critical metric for investors.
Bitcoin dominance and altcoins
Many people are heavily invested in , and when those coins significantly underperform relative to Bitcoin, they may feel confused.
What they might not realise is that rising BTC dominance often indicates a shift in market sentiment towards Bitcoin, meaning that capital is flowing into Bitcoin and away from altcoins.
Tracking BTC dominance helps investors understand why their altcoins might be struggling, offering insight into broader market trends and helping them make more informed decisions.

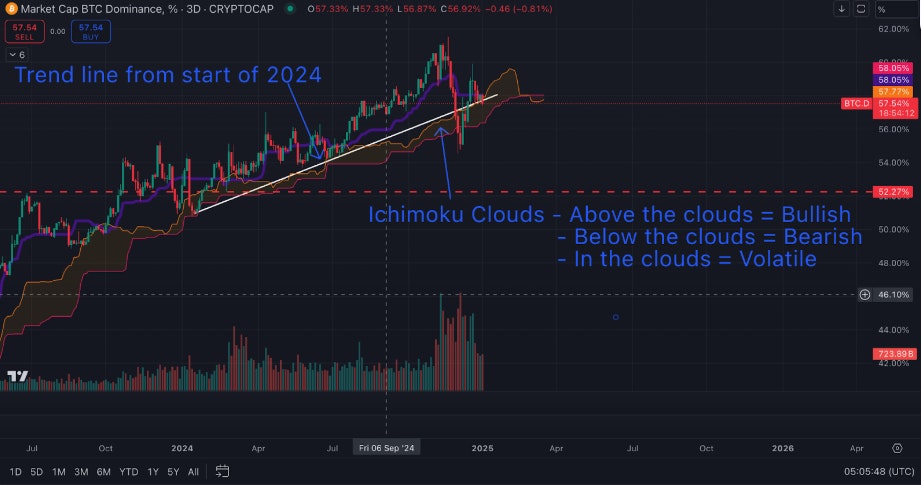
Above: The BTC dominance chart indicates current volatility as it moves within the Ichimoku Cloud, reflecting market indecision.
BTC dominance chart: The Explanation
The BTC dominance chart indicates current volatility as it moves within the Ichimoku Cloud, reflecting market indecision. Historically, being in the cloud suggests a lack of clear bullish or bearish momentum.
Key levels to watch are the upper cloud boundary (~58.05%), which acts as resistance, and the lower boundary (~56.0%), serving as support.
A breakout above the cloud would signal bullish dominance, causing altcoins to drop in price while a drop below it could lead to bearish momentum, leading to an increase in altcoin prices.
A critical region to monitor is the 52% support level. A breakdown below this point could signal the start of a strong altcoin season, where altcoins significantly outperform Bitcoin.
Conversely, if BTC dominance stabilises near the current 55% level or rebounds above 58%, it could delay or prevent this shift. The recent developments underscore the importance of BTC dominance as a key metric for assessing market trends and altcoin potential.
In conclusion
Based on the technical analysis provided in the article, we can identify a few potential scenarios:
BTC dominance is currently moving within the Ichimoku Cloud (between ~56.0% and ~58.05%), suggesting market indecision.
If BTC dominance breaks above 58.05% (upper cloud boundary) this would signal bullish Bitcoin dominance. Altcoins would likely drop in price relative to Bitcoin. Bitcoin would likely capture more of the overall crypto market share.
If BTC dominance falls below 56.0% (lower cloud boundary) and especially below 52%, this would signal the potential start of an "alt season". Altcoins would likely outperform Bitcoin. We could see a significant shift of capital from Bitcoin to altcoins.
However, it's important to note that this is speculative analysis based on technical indicators.
No one can guess the future, even experienced traders. The market appears to be in a period of uncertainty. So take this as an opportunity to learn, and remember to not invest more than you are prepared to lose!

Suggested Articles
What is Bitcoin (BTC)? What is "Digital Gold" Used For?
What is Bitcoin? It is a digital currency that can be traded, exchanged, and used as a form of payment independent of central banks and governments.What is Ethereum? What is ETH Used For?
Ethereum is a decentralised blockchain-based open-source software platform that allows for the development of decentralised applications (dApps).What Is Crypto? How do Cryptocurrencies Work?
Crypto has become incredibly popular. But how does this digital currency work? And are there cryptos other than Bitcoin?Browse by topic

CoinJar’s digital currency exchange services are operated by CoinJar Australia Pty Ltd ACN 648 570 807, a registered digital currency exchange provider with AUSTRAC.
CoinJar Card is a prepaid Mastercard issued by EML Payment Solutions Limited ABN 30 131 436 532 AFSL 404131 pursuant to license by Mastercard. CoinJar Australia Pty Ltd is an authorised representative of EML Payment Solutions Limited (AR No 1290193). We recommend you consider the and before making any decision to acquire the product. Mastercard and the circles design are registered trademarks of Mastercard International Incorporated.
Google Pay is a trademark of Google LLC. Apple Pay is a trademark of Apple Inc.
This site is protected by reCAPTCHA and the and apply.